
 The Garrett Diagram: Its Contribution to Web Development

This diagram is attributed to information architect Jesse James Garrett. He developed it to more clearly explain the processes associated with user experience design and information architecture. Garrett presents and explains this model in his book “The Elements of User Experience”, first published in 2002.
Diagrams are an essential tool, just like Garrett’s Diagram. This framework is ideal for:
Communicating information architecture and interaction design within Web development teams
Since 2002, this diagram has been a useful and necessary asset for designing website usability, architecture, and accessibility. It visually summarizes the elements that make up the user experience (UX). But what exactly does this diagram consist of, and why is it so important? In this Tecnova article, we’ll explore it in detail.
What is UX design and why is it important?
As application development technologies evolve, there are more variables to consider. A product, application, or website that doesn’t deliver real value to users will quickly become obsolete. This is because people have endless options—there are always multiple apps that do the same thing.
So, how do you make that application or software truly unique and valuable for the client? This is where UX development becomes essential. In fact,
developer Omar Elgabry outlines the concept through the following principles:
- UX is a process: From gathering requirements to delivering a tangible product.
- UX is about understanding the user: When we interact with a website, software, or application—perhaps to make a purchase—we make decisions as we navigate. UX studies all of those decisions, considering every action the user will take.
- You must know your users: UX is about understanding people—how they react, what they need, and what they love or dislike about a site or application.
- It’s an equation of many variables: User experience aims to combine business goals, user goals, user interface, and back-end processes.
- It includes several key attributes: Useful, desirable, accessible, credible, findable, and usable. These attributes have the greatest impact and create the most value for customers.
So how does Garrett’s diagram fit into all of this?
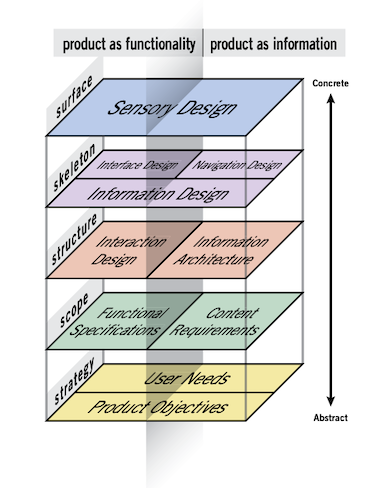
Garrett argues that there is a fundamental duality in the elements that make up UX. According to the UX designer:
“The Web was originally conceived as a hypertext information space. But the development of increasingly sophisticated technologies—both in deployment and in administration—has supported the use of the Web as a remote software interface.”
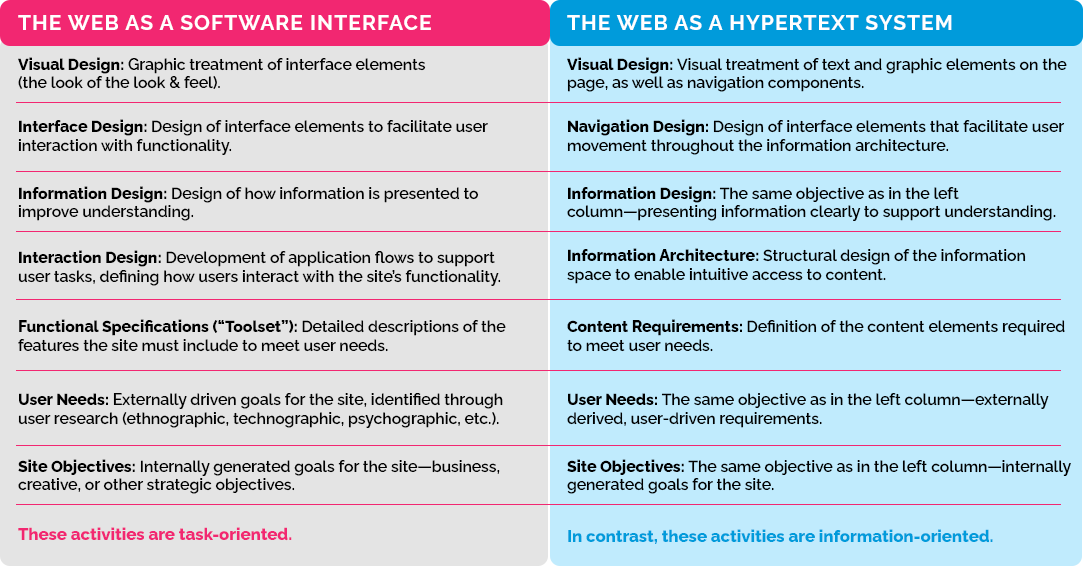
He states that designing any web application has a “dual nature” that often creates confusion. For Garrett, the reason is that:
“Practitioners of user experience (UX) development have attempted to adapt their terminology to cases beyond the scope of its original application.”
Therefore, the goal of this diagram is:
“To define some of these terms within their appropriate context and clarify the underlying relationships among these various elements.”
The Spanish translation of this diagram was obtained from Garrett’s official website.
Below, we present the ‘dual nature’ Garrett described:
At Tecnova, we help companies design and implement custom technology solutions, developing software and digital strategies that enhance productivity, innovation, and competitiveness.
Want to find out which option is best for your company?
Let’s talk and design your technology roadmap together.
The Garrett Diagram: Its Contribution to Web Development
Diagrams are an essential tool, just like Garrett’s Diagram. This framework is ideal for:
Communicating information architecture and interaction design within Web development teams
Since 2002, this diagram has been a useful and necessary asset for designing website usability, architecture, and accessibility. It visually summarizes the elements that make up the user experience (UX). But what exactly does this diagram consist of, and why is it so important? In this Tecnova article, we’ll explore it in detail.
What is UX design and why is it important?
As application development technologies evolve, there are more variables to consider. A product, application, or website that doesn’t deliver real value to users will quickly become obsolete. This is because people have endless options—there are always multiple apps that do the same thing.
So, how do you make that application or software truly unique and valuable for the client? This is where UX development becomes essential. In fact,
developer Omar Elgabry outlines the concept through the following principles:
- UX is a process: From gathering requirements to delivering a tangible product.
- UX is about understanding the user: When we interact with a website, software, or application—perhaps to make a purchase—we make decisions as we navigate. UX studies all of those decisions, considering every action the user will take.
- You must know your users: UX is about understanding people—how they react, what they need, and what they love or dislike about a site or application.
- It’s an equation of many variables: User experience aims to combine business goals, user goals, user interface, and back-end processes.
- It includes several key attributes: Useful, desirable, accessible, credible, findable, and usable. These attributes have the greatest impact and create the most value for customers.
So how does Garrett’s diagram fit into all of this?
Garrett argues that there is a fundamental duality in the elements that make up UX. According to the UX designer:
“The Web was originally conceived as a hypertext information space. But the development of increasingly sophisticated technologies—both in deployment and in administration—has supported the use of the Web as a remote software interface.”
He states that designing any web application has a “dual nature” that often creates confusion. For Garrett, the reason is that:
“Practitioners of user experience (UX) development have attempted to adapt their terminology to cases beyond the scope of its original application.”
Therefore, the goal of this diagram is:
“To define some of these terms within their appropriate context and clarify the underlying relationships among these various elements.”
The Spanish translation of this diagram was obtained from Garrett’s official website.
Below, we present the ‘dual nature’ Garrett described:
At Tecnova, we help companies design and implement custom technology solutions, developing software and digital strategies that enhance productivity, innovation, and competitiveness.
Want to find out which option is best for your company?
Let’s talk and design your technology roadmap together.